What is a Sankey Diagram?
A Sankey Diagram is a type of flow chart which shows how the energy is transferred to.They are quite often used to visualize energy.
How are they represented?
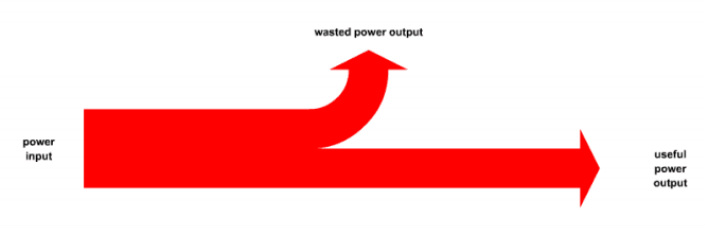
The Source of the Arrows- This represents the amount of energy that is put in. Then it splits into two for the two outputs.
Straight line- The straight arrow which goes through the diagram shows the amount "Useful Output". This is the energy that is transferred in the form that you wanted.
Curved/ Bent line- The curved arrow shows the amount of "Wasted Energy". This is the energy that isn't transferred in the form that you wanted, this effects the efficiency of the object.
How to draw Sankey diagrams?

